Charts and Graphs
Data visualizations are an integral part of many NetApp digital products and websites. LUCI recommends a specific visual language for charts and graphs, optimized for usability and legibility.
Visual Style
Color
The color palette for LUCI charts and graphs is distinct from the primary, more broadly applicable LUCI color palette. The colors outlined below are designed to be used in order based on the number of data points in the chart or graph.
The primary considerations for the LUCI chart color palette include:
Accessibility Ensure sufficient contrast between colors when comparing up to 10 data points, using the “Stark” plugin for Sketch which simulates colorblindness. These colors were tested for the following: Protanopia, Protanomaly, Deuteranopia, Deuteranomaly, Tritanopia, Tritanomaly, Achromatopsia and Achromatomaly.
Cohesiveness Ensure cohesiveness within the chart palette (when extended) and with the broader core LUCI color system.
Charts can also reveal warning ranges and thresholds as follows:
Chart Styles Reference
| Chart element | Mixins/variables/outcome | Properties |
|---|---|---|
|
Chart Title |
Chart Title Example |
Helvetica Neue Semibold |
|
Value Large |
Value Large Example
|
Helvetica Neue Semibold |
|
Value |
Value Example
|
Helvetica Neue Semibold |
|
Value Small |
Value Small Example
|
Helvetica Neue Semibold |
|
X/Y Axis Units/Dates Small |
X/Y Axis Units/Dates Small Example
|
Helvetica Neue Regular |
|
X/Y Axis Units/Dates |
X/Y Axis Units/Dates Example
|
Helvetica Neue Regular |
|
Dividers |
|
solid 1px #CCCCCC |
|
Popover Border |
|
solid 1px #B3B3B3 |
|
End Points |
|
8px |
|
End Point Hover |
|
3px |
|
Hover Bar |
|
12px |
|
Legend |
Chart Legend Example
|
Helvetica Neue Semibold |
Example Line Chart Design
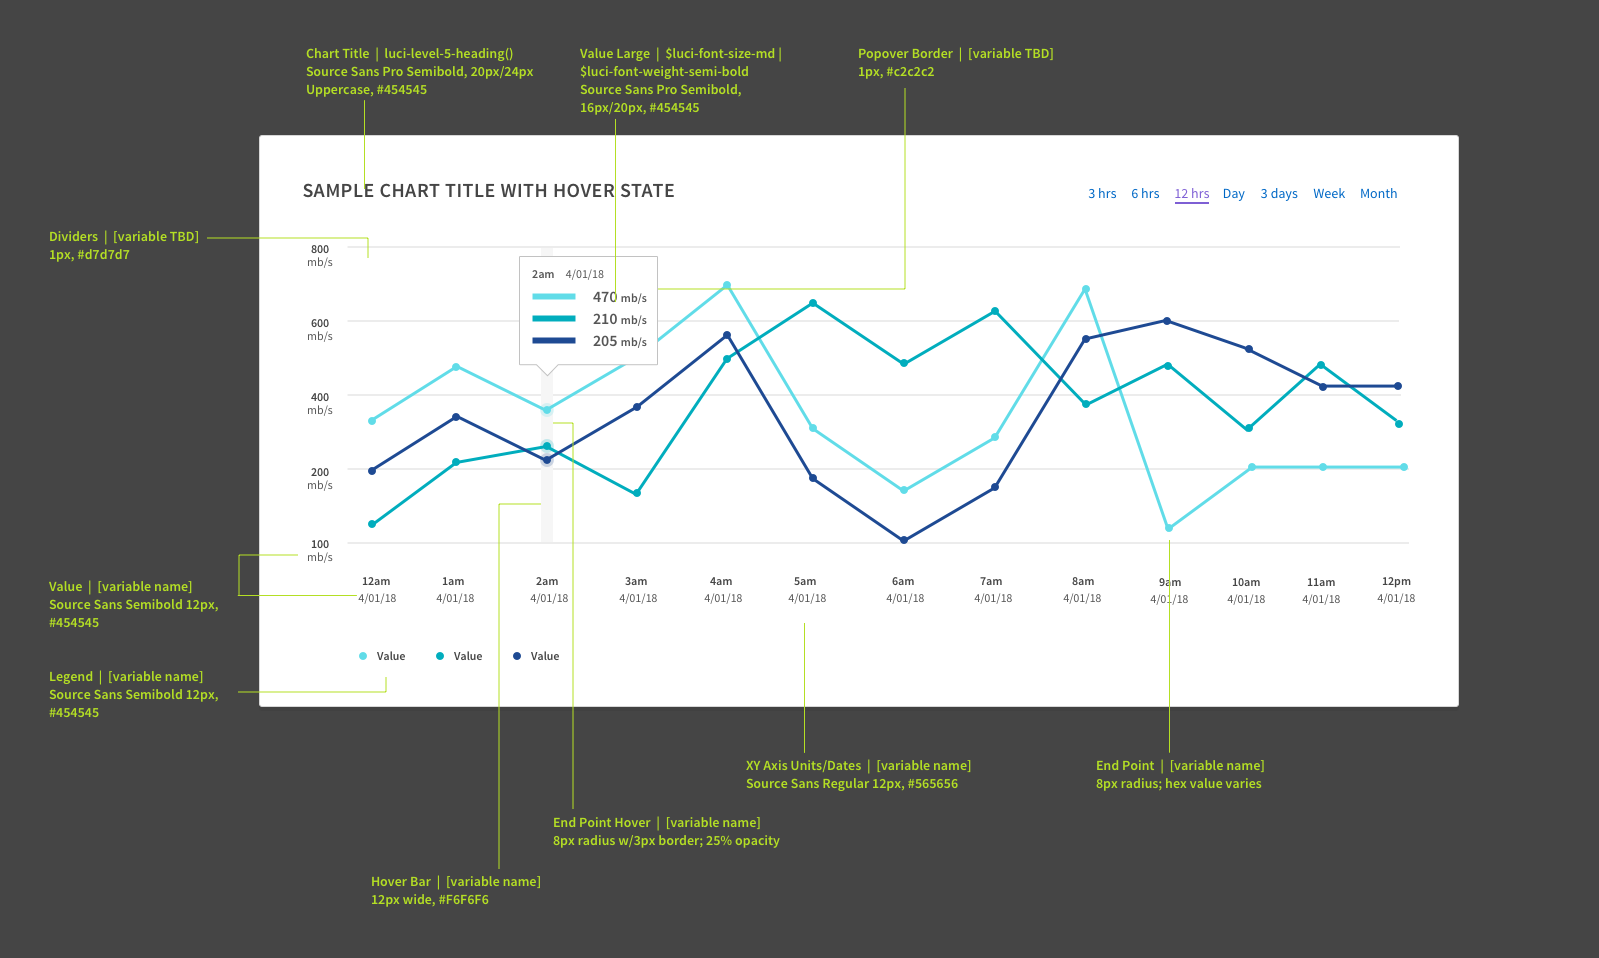
Chart Structure
The LUCI chart structure places core elements consistently.
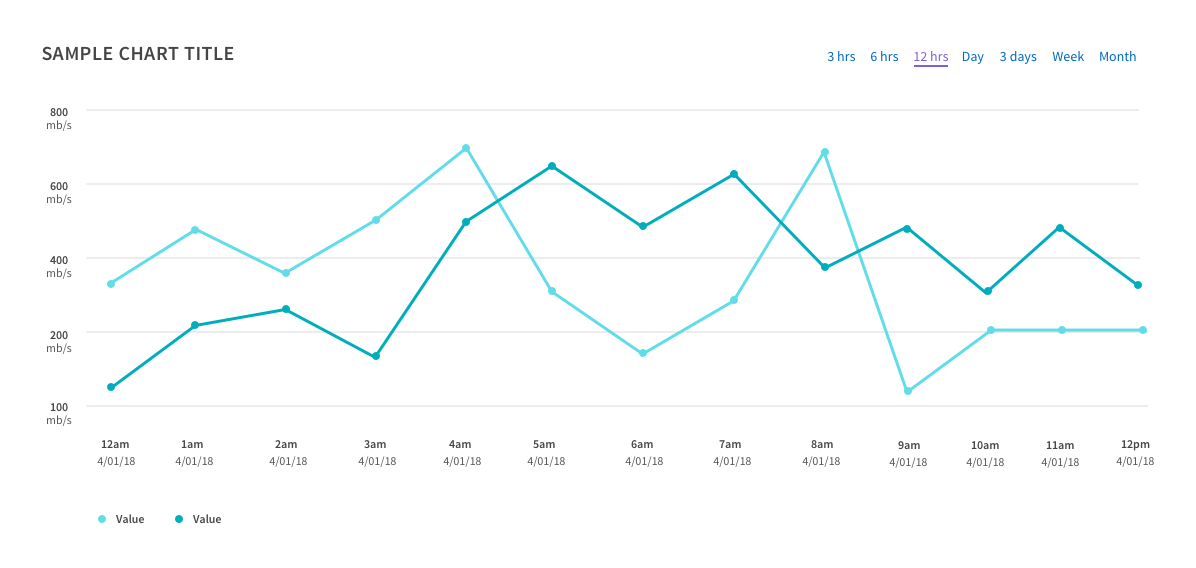
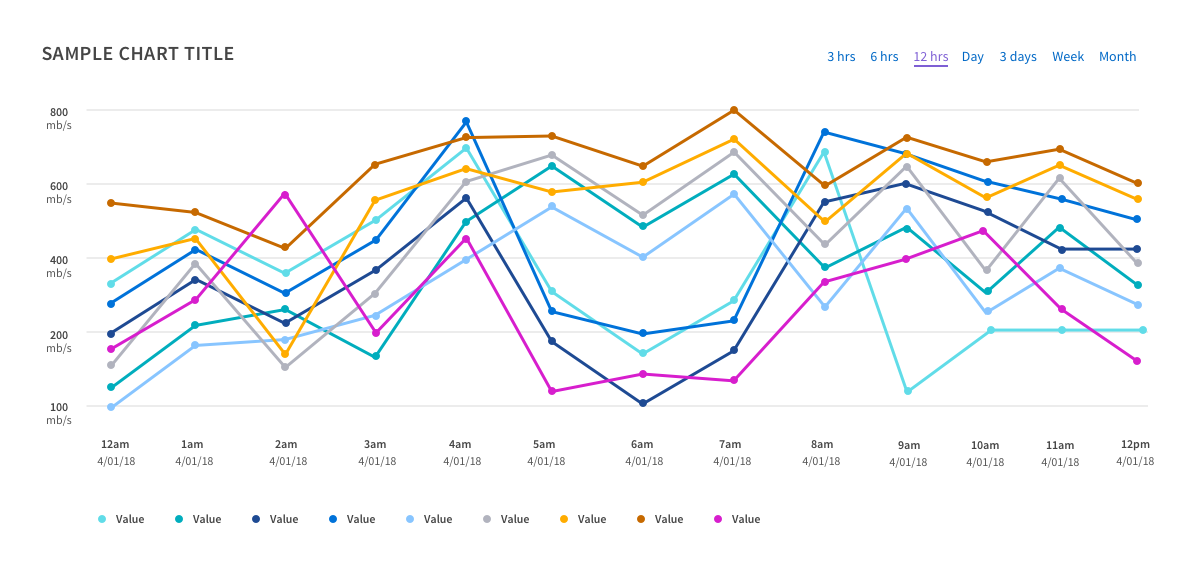
Line Charts
Line charts are good for showing continuous data over time. They can be used to plot a single point, or to allow the user to see the relationship between (and compare) up to 10 data sets.
Color Progression
LUCI line charts were designed to follow a distinct color order based on the number of values available. A handful of examples are outlined below.
For data points not represented (e.g., 5, 8, 9 data points), simply use the ordered progression of the colors outlined above based on the corresponding data points in your graph.
2 data points
3 data points
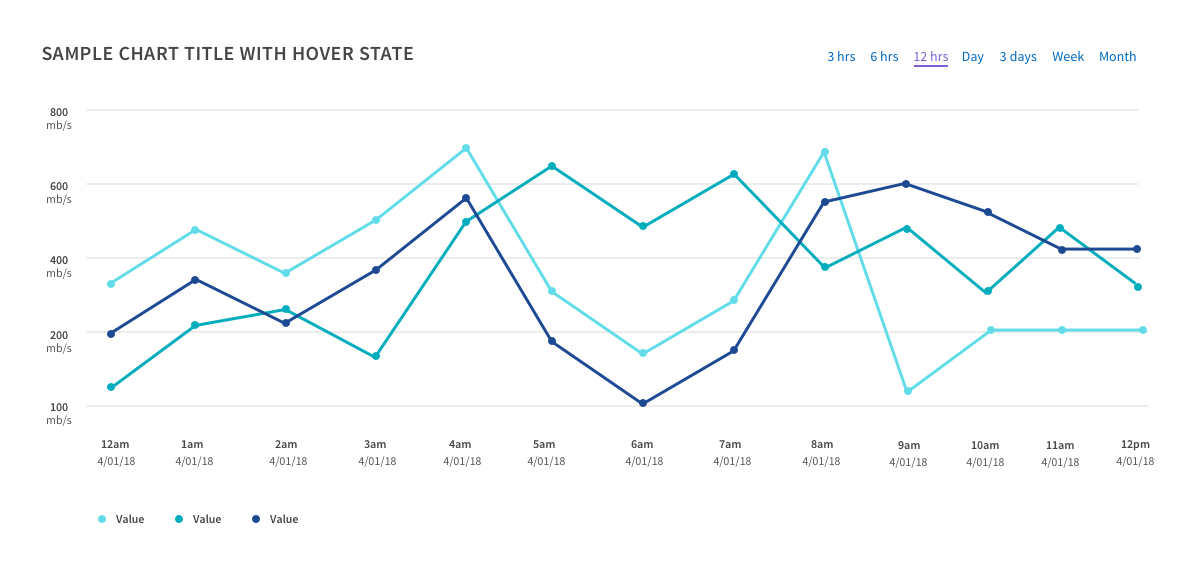
6 data points
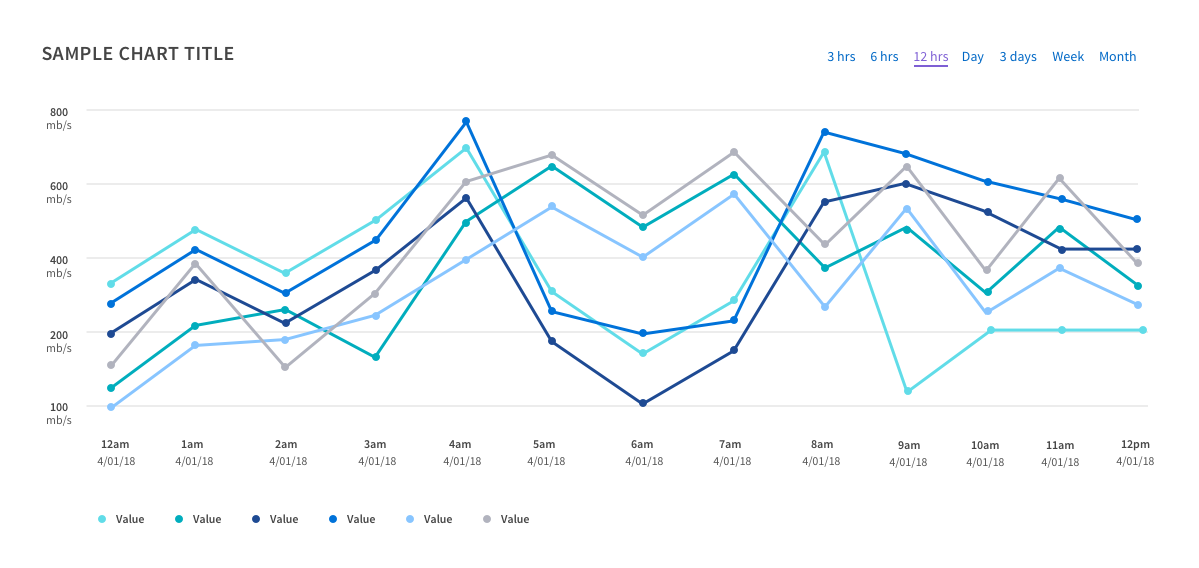
9 data points
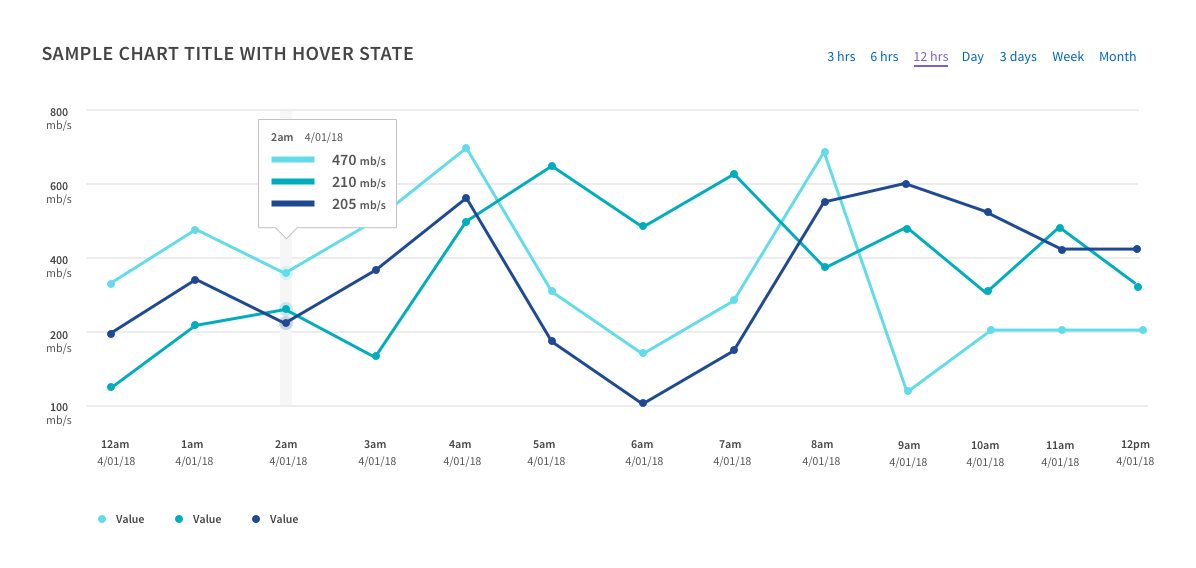
Data Overlay Panel
An overlay panel is available on-click of the x-axis, to reveal the data across all plotted items for that segment.
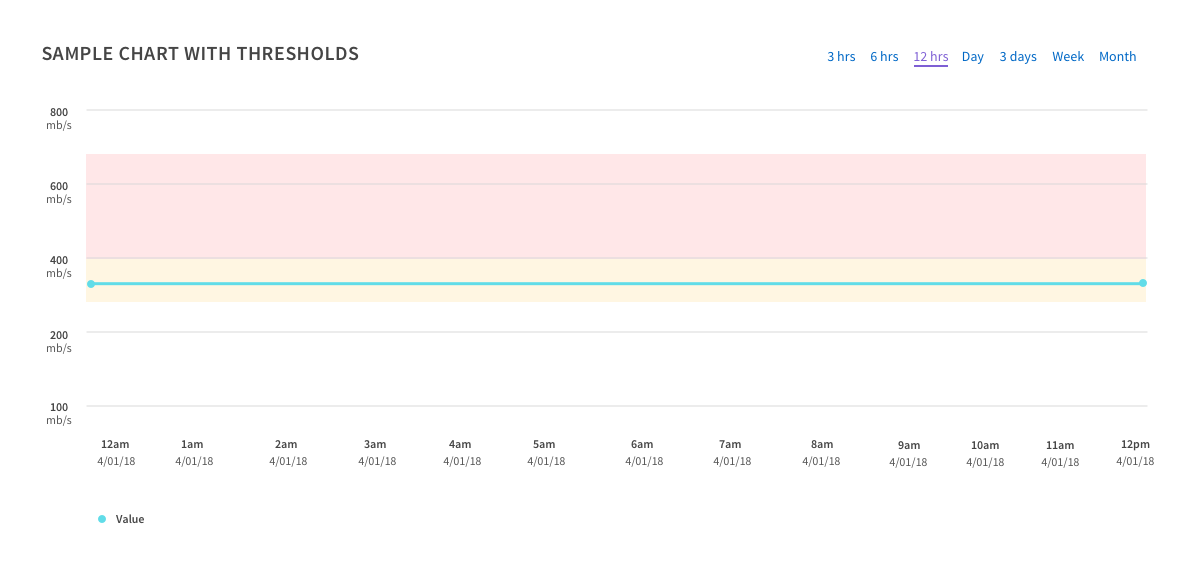
Revealing Thresholds
Color can be added to line chart backgrounds to reveal significant thresholds to users as illustrated below:
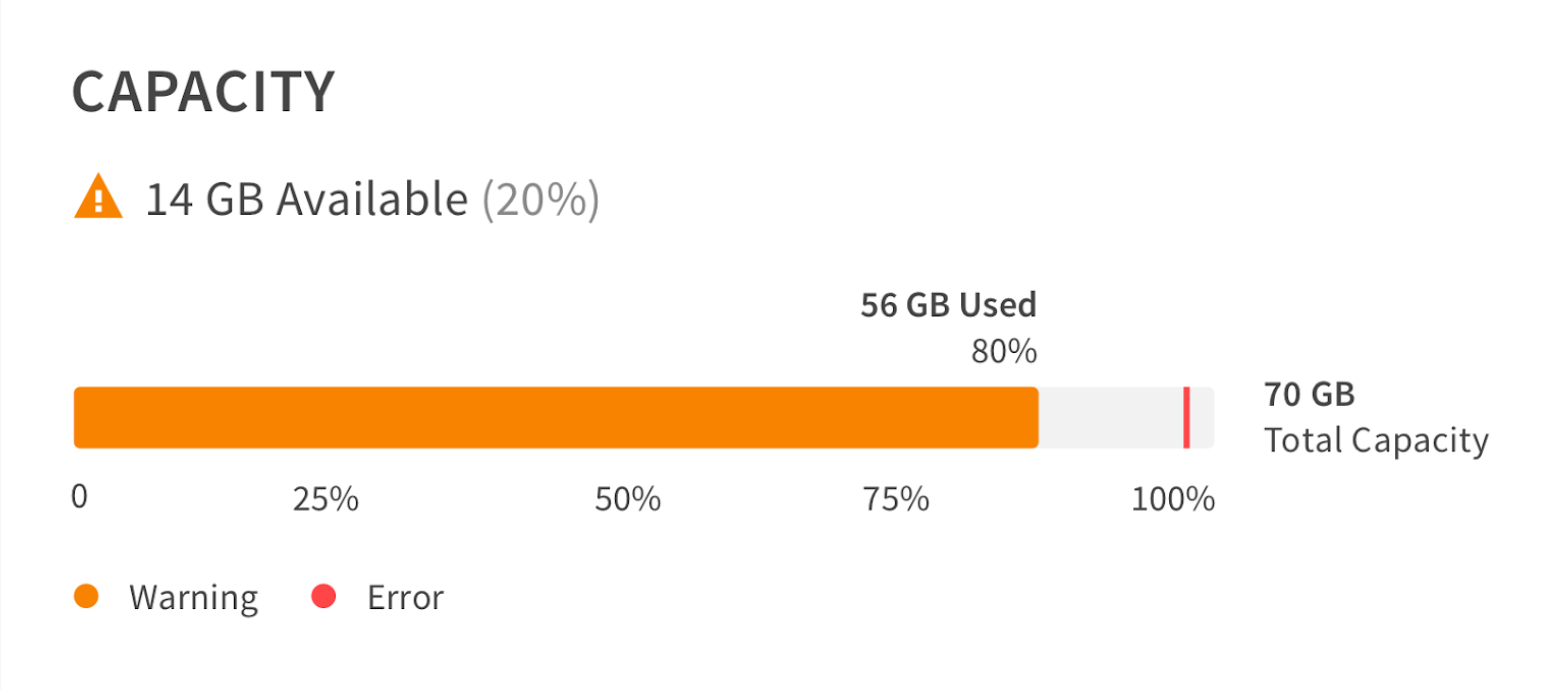
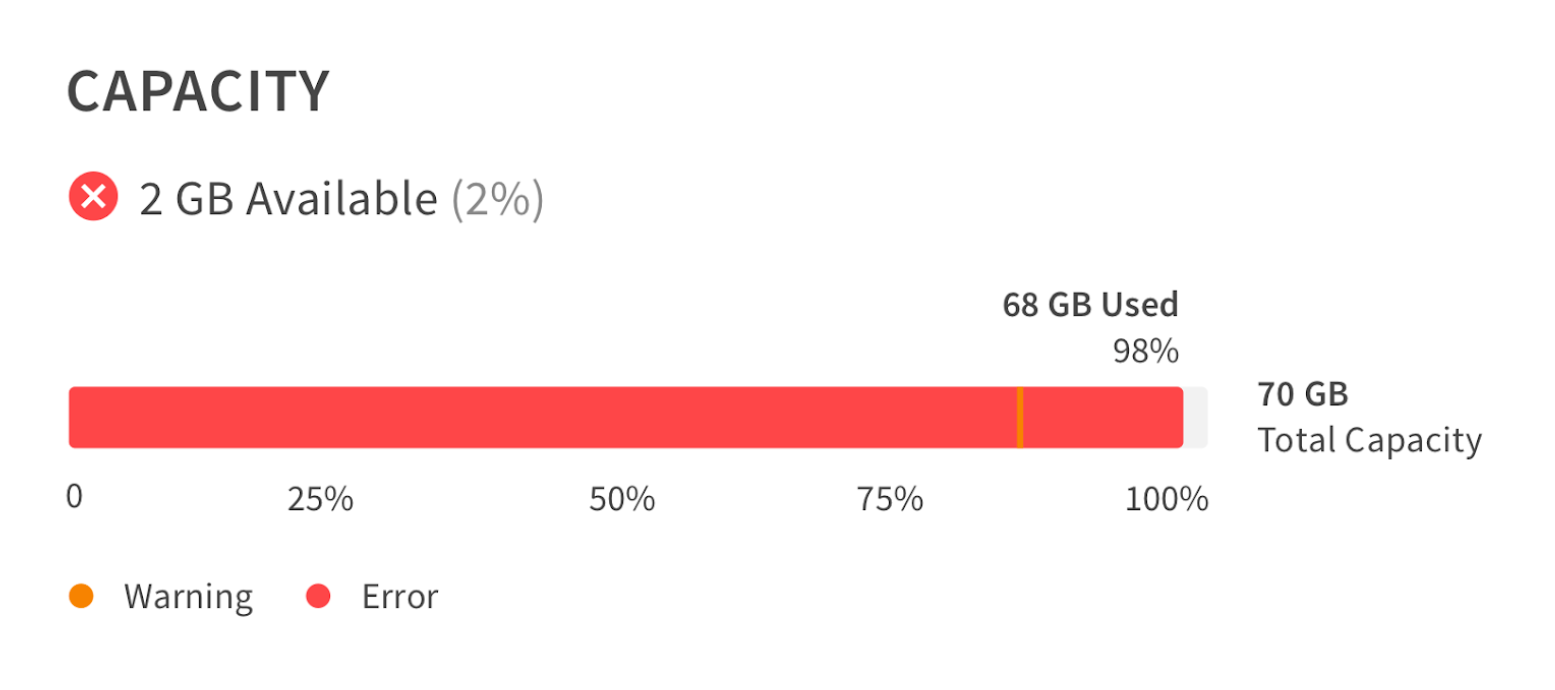
Utilization Charts
Utilization charts are an important data visualization at NetApp since there is often a need to reveal available capacity, performance, and other storage values.
Standard / Default
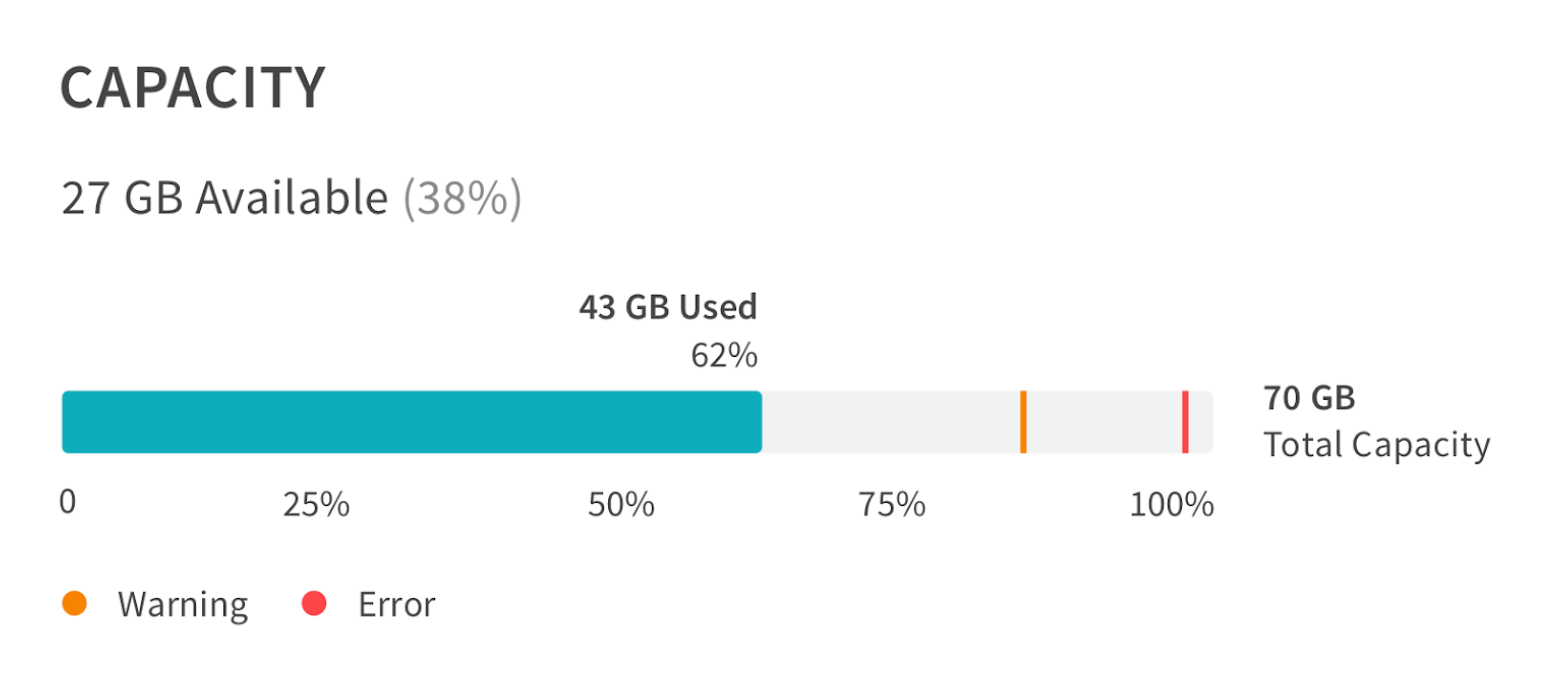
Warning Threshold
Error / Violation Threshold
Implementation
There is not yet a universal, code-based charts & graphs library. However, chart styles can be applied using the appropriate variables as illustrated above and available within the LUCI token file. Designers and developers should use styles and examples provided to guide implementation efforts.